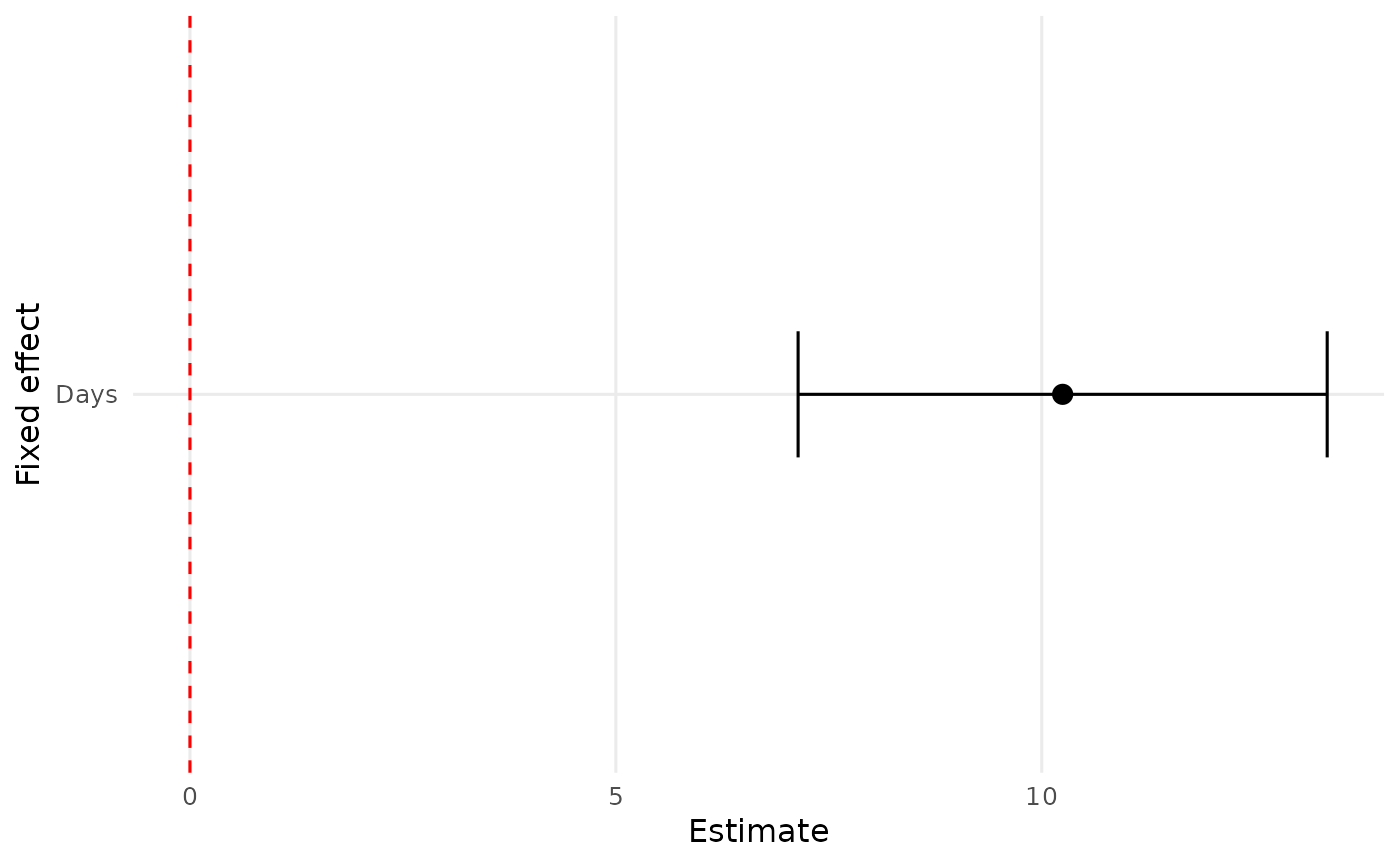
Plot the simulated fixed effects on a ggplot2 chart
Usage
plotFEsim(
  data,
  level = 0.95,
  stat = "median",
  sd = TRUE,
  intercept = FALSE,
  sigmaScale = NULL,
  oddsRatio = FALSE
)
Arguments
- data
a data.frame generated by
FEsimwith simulations of the fixed effects of amerMod- level
the width of the confidence interval
- stat
a character value indicating the variable name in data of the midpoint of the estimated interval, e.g. "mean" or "median"
- sd
logical, indicating whether or not to plot error bars around the estimates (default is TRUE). Calculates the width of the error bars based on
leveland the variable named "sd" indata- intercept
logical, should the intercept be included, default is FALSE
- sigmaScale
a numeric value to divide the estimate and the standard deviation by in the case of doing an effect size calculation
- oddsRatio
logical, should the parameters be converted to odds ratios before plotting